Reports and Analytics
Access easy-to-read analytics and historical data

Reports and Analytics
Access easy-to-read analytics and historical data

With just one click, you can have
+20% Sales
+8% Margins
Time and cost savings
98.5% data accuracy

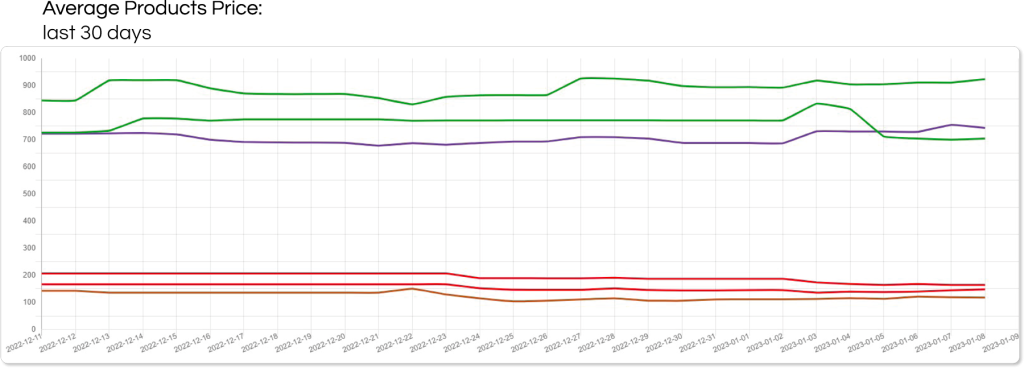
Historical Data Analysis
Data from the monitoring architecture is stored and made available to customers for trend analysis, with various calculations available, including price deviation, threshold, promo discount %, and others. Through a simple configuration panel, users can define the analysis parameters according to their specific needs and have the results displayed instantly.
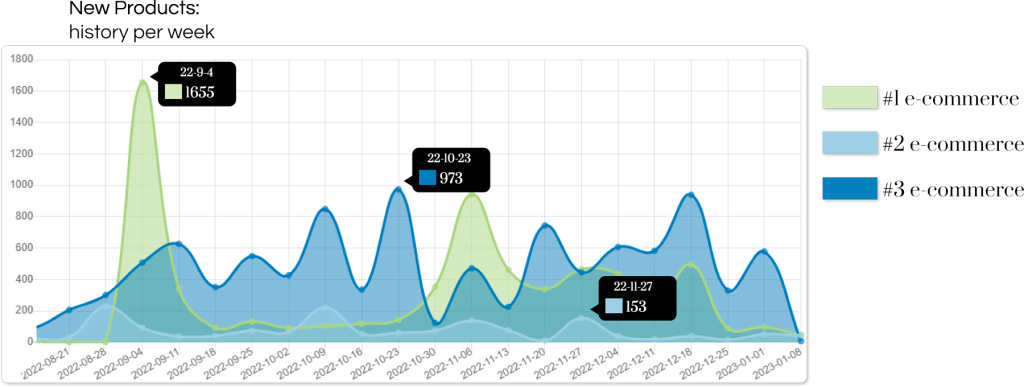
New Product Trends
The product assortment in e-commerce environments and brand catalogs are constantly changing. There may be more or fewer products per category, new brands in the assortment, and variations within the special offer category. By storing data on catalog and special offer assortment changes, you can obtain valuable information regarding trends and the strategies adopted by other brands and e-commerce sites.


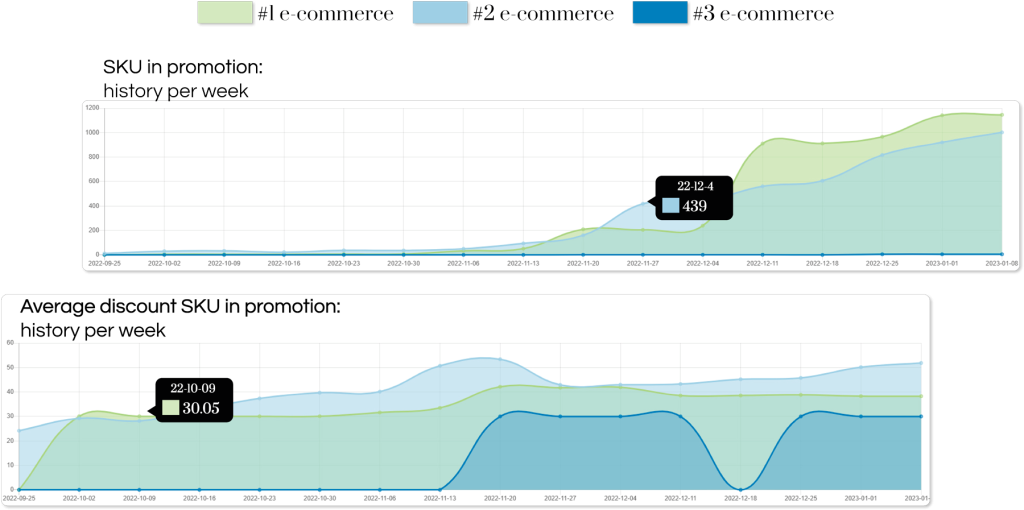
Promotional Pressure and Historical Trend Analysis
Promotional pressure affects sales as well as customers’ perceived value of brands. That’s why it’s important to constantly monitor the number of items on special offer and the discount percentage applied by e-commerce sites on the original price as well as on the brands’ suggested retail price. Storing the gathered data makes historical analysis of trends possible.
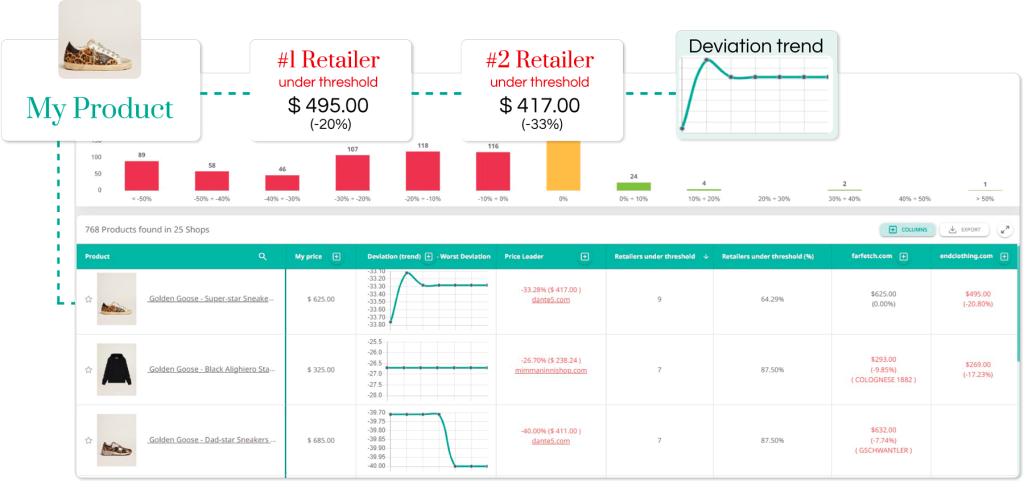
Threshold analysis
Monitoring price thresholds is important to protect the value of the brand and identify the e-commerce sites that are most compliant. The platform offers a number of different methods for day-to-day and historical monitoring of this crucial indicator. The graphic mode provides a very direct view of the data and, via drill down analysis, let’s you start from a top-level view to arrive at the detailed identification of any distortions that are likely to negatively affect brand value.
